
SEI Price Prediction Points to $0.70 After Forming Double-Bottom


Early Market Structure and Pattern Formation


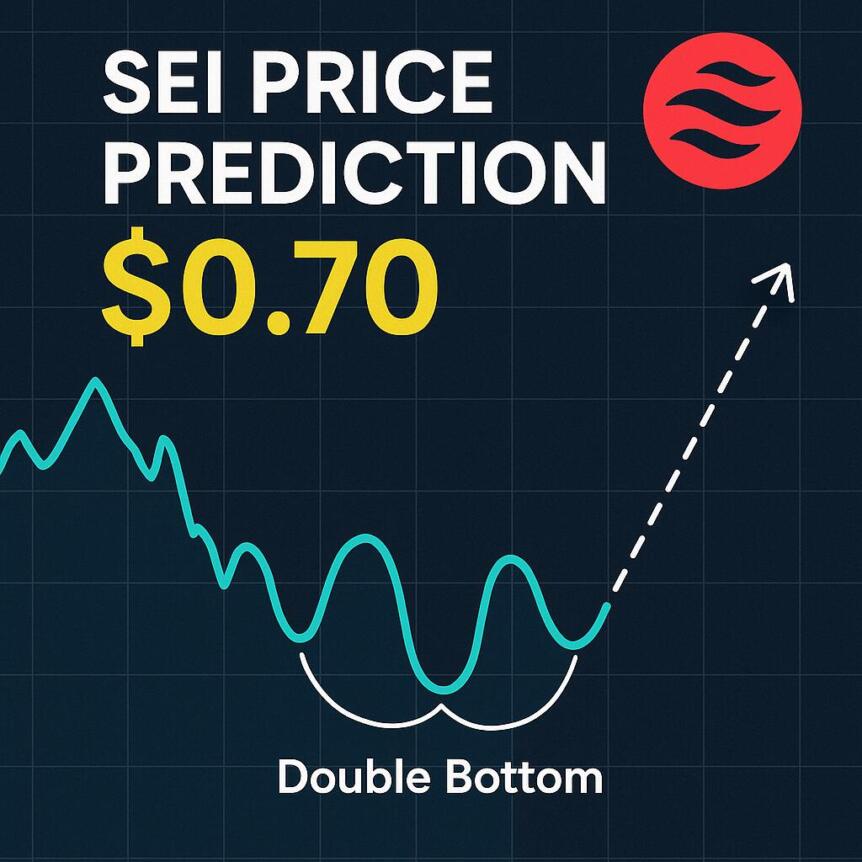
SEI shows a potential double-bottom pattern as it trades around $0.148 while forming a broader accumulation range. The neckline near $0.35 remains the key trigger, and any confirmed breakout may open the path toward a possible $0.70 objective.

Pattern and Current Price Structure


As of writing, SEI trades near $0.1488 after testing support at $0.1450. The chart presents lower highs since late 2024 and continued pressure into early 2025. The rounded bottoms appear near $0.135–$0.145 and $0.125–$0.140.

The neckline sits at $0.34–$0.35 and serves as the main structural signal. A public post by Ali pointed out this pattern and referenced the potential $0.70 projection. The comment aligns with classical double-bottom measurements used in technical analysis.


Technical Indicators and Short-Term Paths


Short-term momentum remains negative, with SEI trading below the short EMA. That EMA has acted as steady resistance since November 15. Price rejections near $0.156–$0.158 confirm the persistent pressure.

The RSI is near 29, indicating an oversold condition that could attract short-term bids. No divergence is visible at this stage. Support levels include $0.1450, $0.1400, $0.1320, and $0.1250. Resistance appears at $0.1535, $0.1600, and $0.1700. A mild recovery could test $0.153–$0.158 and challenge the EMA, representing an early improvement in structure.
Source TradingView

Price Targets and Outlook Scenarios


A double-bottom projection places the main target at about $0.70. This objective sits beyond the neckline and aligns with the pattern’s measured move. A breakout above $0.35, supported by rising volume, would be required to validate this route.

If downward pressure continues, a move below $0.1450 could bring $0.1320 and $0.1250 into play. That outcome would weaken the broader reversal attempt and keep the price within the current downtrend. Traders watching the price prediction trends may monitor volume, EMA structure, and RSI behavior for confirmation signals.

The sei price prediction framework depends entirely on a clear move above the neckline and a shift in volume strength. Without these elements, the existing trend remains intact.

Final Thoughts


This outlook provides clear levels for traders. A confirmed move above $0.35 may open the road toward $0.70, while strict risk controls remain essential as long as SEI trades in oversold conditions.

https://www.cryptobreaking.com/sei-price-prediction-points-to/?utm_source=blogger%20&utm_medium=social_auto&utm_campaign=SEI%20Price%20Prediction%20Points%20to%20$0.70%20After%20Forming%20Double-Bottom%20

Comments

Popular posts from this blog

Coinbase's x402 launches AI agents app store for payments

Coinbase-backed x402 has unveiled Agentic.market, a dedicated marketplace aimed at increasing the usefulness of AI agents by aggregating thousands of apps and services that agents can access without any API keys. The rollout positions the platform as a central hub for agents to discover, evaluate, and deploy capabilities across a standardized payments layer. Coinbase product lead Nick Prince described Agentic.market in a video posted on X as a storefront for discovering, comparing, and using x402 services. The marketplace is designed to give both humans and their AI agents access to a wide range of tools—from data feeds to consumer apps—without the friction of managing API credentials. A storefront for discovering, comparing, and using x402 services. Thousands of services. Zero API keys. Powered by x402. Prince added that the market offers a web interface for humans to browse and assess services, alongside a programming layer that lets AI agents autonomously search, filter, and integra...

Top Cryptocurrencies to Watch: BTC, ETH, BNB, XRP, Solana, Dogecoin & More

Market Analysis and Price Predictions for Key Cryptocurrencies Recent market dynamics reveal a cautious sentiment across the cryptocurrency landscape, with Bitcoin struggling to maintain levels above $90,000 and many major altcoins facing downward pressure. Indicators point toward reduced participation from both institutional and retail investors, raising concerns about a potential consolidation phase after notable gains earlier in the year. Bitcoin has fallen below $87,000, reflecting waning demand at higher price points. Institutional fund flows into BTC and ETH ETFs have turned negative, indicating a period of subdued market activity. Active addresses and Binance deposit/withdrawal activities are at annual lows, suggesting market indecision. Most leading altcoins are approaching support levels, with some poised for potential breakdowns. Tickers mentioned: Bitcoin, Ethereum, Binance Coin, XRP, Solana, Dogecoin, Cardano, Bitcoin Cash, Chainlink, Hyperliquid Sentiment: Neutral to Sli...

Analyst: Bitcoin can reclaim $100K without a new narrative

Bitcoin has stalled below the $100,000 threshold, marking a run of almost five months without a breakout above that level. As of the latest market close, BTC hovered around $78,250 after a February nadir of about $60,000, underscoring a slow, grinding recovery amid broader market dynamics. In parallel, tech markets—especially AI-focused equities—have captured the spotlight, with investors rotating capital away from crypto in search of different risk-reward profiles. Nvidia (NVDA), the leading AI stock by market cap, has gained about 5.08% since the start of the year, while Bitcoin has faced a roughly 10% dip over the same period, illustrating a diverging performance within risk assets. MN Trading Capital founder Michael van de Poppe suggested that Bitcoin may not require a fresh narrative to push back above $100,000. In a post on X, he asked what narrative would drive BTC to the milestone and concluded that “price moves upwards, and the narrative will create itself.” He continued that ...